Module 5: Mastering Community Data & Analytics
Measuring community engagement is crucial for evaluating the success of any Web3 community. Keeping an eye on the engagement, growth, and retention numbers helps determine if your strategy is working!

In this module, we'll explore the importance of data and analytics in community building. Using metrics will help you measure your strategy success and refine any area you need to improve.
What you’ll learn: How to measure engagement, growth and retention metrics as well as how to turn this data into action. By the end of the module, you will know to effectively track the performance of your community over time and gain insights into its effectiveness.
Best Practices for Analyzing Data
Make sure to maximize the value of your data! We created a guide that will help you make strategic decisions based on your metrics:
Start with a clear goal
Before diving into data analysis, it's essential to have a clear goal in mind. This will help you stay focused and ensure that you're analyzing the right data.
Example: Increase the number of users over time, Increase participation, reduce the number of people leaving your community, etc.
Health Check
Let’s Assess the status of your community! Do you know the answer to all these?
- Profiles: Who are the most engaged community members?
- Active users: The number of users who interact with your community within a certain time.
- Retention rate: The percentage of users who continue to use your community over time.
- Time spent on (any) platform: The average amount of time users spend on your platform(s).
- Number of posts or comments: The total number of posts or comments made by users.
Tracking Engagement
Looking for a starting point or trying to improve your current strategy? We suggest you check these basics:
Focus on your community actions
Your community will react to your strategies in different ways, and their response can provide great feedback to help you determine if you're heading in the right direction.
All user actions will be the engagements you achieved, and the ones you need to count will depend on the platform you are using and your strategy foundations.
Retweets + mentions + comments + branded hashtags used after your post + DMs + shares + saves
Example: Let's say you recently posted a tweet promoting your new dApp. Your community members reacted in the following way:
- 25 retweets
- 60 likes
- 18 replies
- 10 mentions
- 20 clicks on the link to your dApp (within the tweet)
Take note of these numbers because we’ll use them later 👇
All of those are the number of engagements your tweet got. There can be more data like views, reproductions etc, but again, the ones that will be more useful for you depend on your strategy and objectives.
Identifying the metrics you need
Start by looking at the goals you have set and identify the metrics that suit them best.
Example: If your goal is to increase awareness or reach, you should ask yourself: How many people are viewing my post? How many people are sharing it? How many people are liking it? In particular, pay attention to retweets, likes, and mentions. This data will allow you to determine whether your content is spreading and attracting attention.
Consider the quality of these actions
Let's really look into the quality of your content and avoid non-meaningful engagement! Are bots leaving multiple comments? What type of feedback are you receiving from your post?
Analyze your data
Now that you identify what you want to measure, let’s analyze your engagement and what it means to your project:
Engagement rate: This is the percentage of people who chose to interact with your content.
We believe is important for you to understand how these tools measure engagement 😉 And, Yep! There are several formulas you can use! Keep in mind that the number is not 100% exact and there is not a single rule to follow. Instead, consider this as a general overview of how your community is reacting.
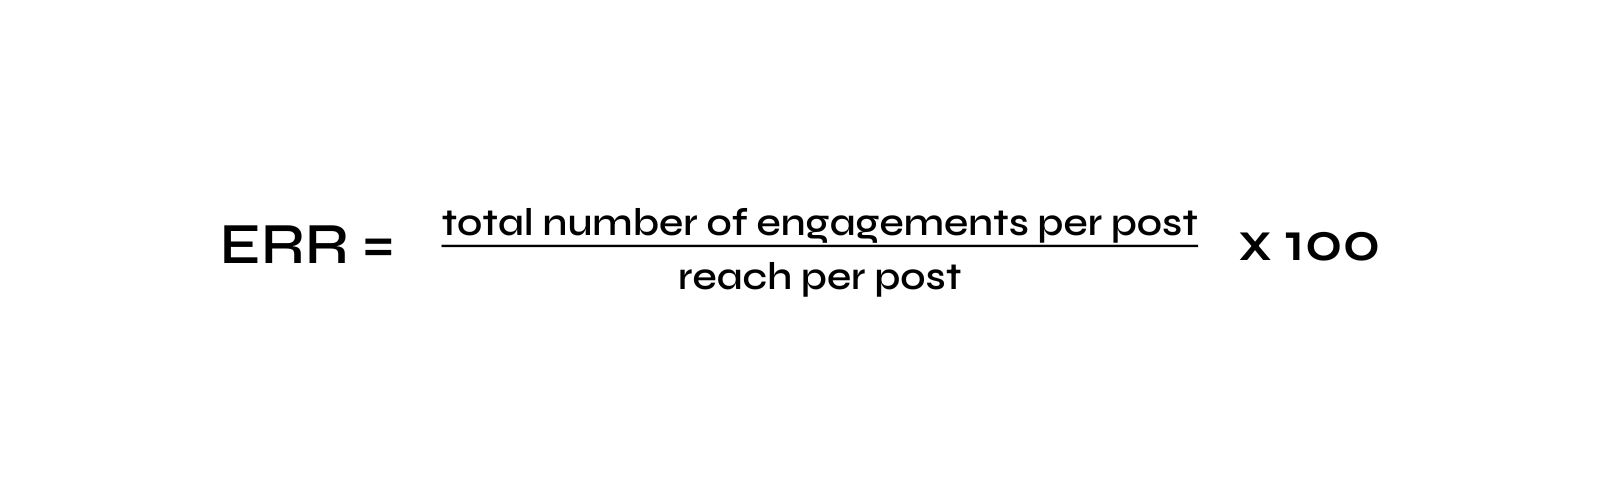
The most common formula is the ERR (Engagement Rate by Reach). It measures the percentage of people who interacted with your content after seeing it.
So, for 1 single post, you can use this formula:
Example: let’s say you have 10,000 followers, and the reach (people who saw the post) is 2,000.
Remember the data we collected before? Now we can calculate the engagement rate for the post as follows:
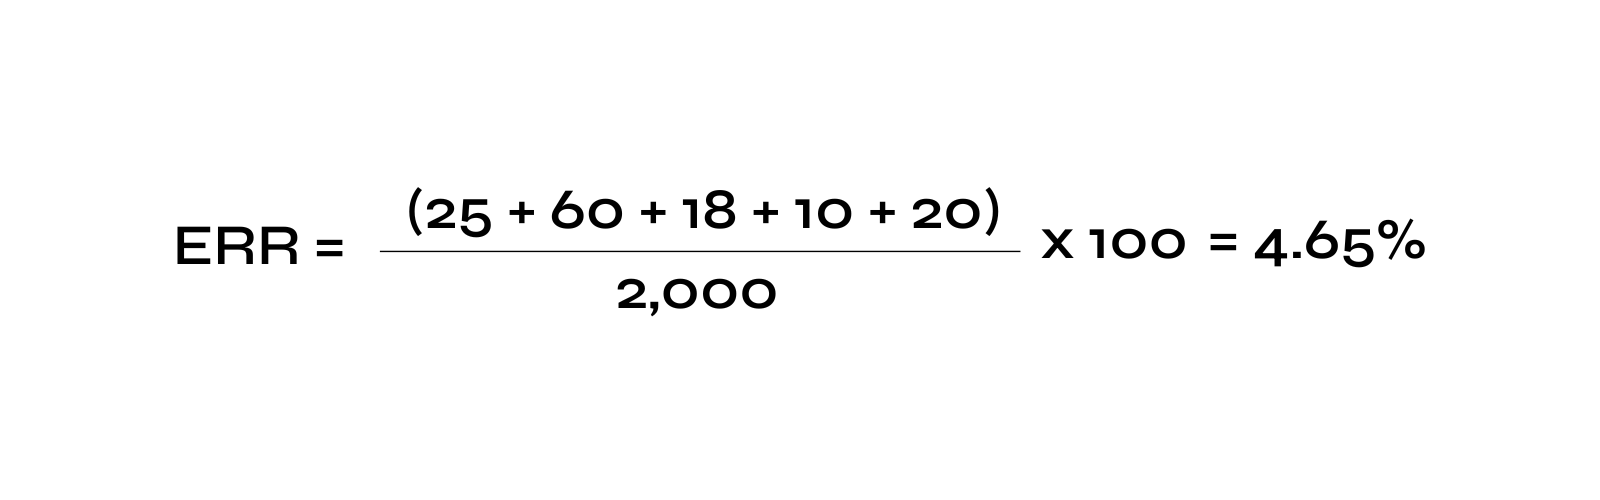
This means that 4.65% of the people who saw the post, engaged with it.
So, now let's say you want to know the engagement of many recent tweets (i.e you want an average for your monthly posts) you can use a specialized platform to save you time or you can use use the next formula:
Average ERR = Total ERR / Total posts In other words: Post 1 (4%) + Post 2 (4.5%) / 2= 4.25%
Other Metrics to Measure
- Churn rate: The rate at which users leave your community over time. This is the opposite of the retention rate and can help you understand how many users you lose and why.
- Frequency of engagement: How often users engage with your community, such as the number of logins or posts made per week or month. This can help you understand how often users find value in your community and whether they're likely to stick around.
- Time spent on the platform: This can help you understand how engaging your community is and whether users find enough value to spend a significant amount of time there.
- New user retention: The percentage of new users who continue to engage with your community after a certain amount of time (e.g. 30 days, 90 days). This metric helps you understand how effective your onboarding process is and whether new users find your community valuable.
- Overall retention: The percentage of all users who continue to engage with your community over time. This metric helps you understand the long-term health of your community and whether users are finding value in your community over time.
Examples
Let's say you want to know how many people leave and how many stay. If you have a community of 1,000 users:
- Churn rate: In the past month, 50 users left the community. This means the churn rate is 5% (50/1000).
- New user retention: After 30 days, 400 (new) users are still engaging with your community. This means your new user retention rate is 40%.
- Overall retention: After 90 days, 600 users are still engaging with your community. This means your overall retention rate is 60%.
If you notice a low new user retention rate, you might consider improving your onboarding process or providing more value to new users.
Growth
Community growth is all about bringing new members to your community. Here are some metrics you can use to measure it:
Number of new users: This is the most basic metric for measuring community growth. Simply count the number of new users who join your community and compare it to previous periods (weekly, monthly, quarterly, etc.)
Conversion rate: This is the percentage of people who visit your community and become users. You can calculate this by dividing the number of new users by the number of visitors to your community.
To calculate the conversion rate:
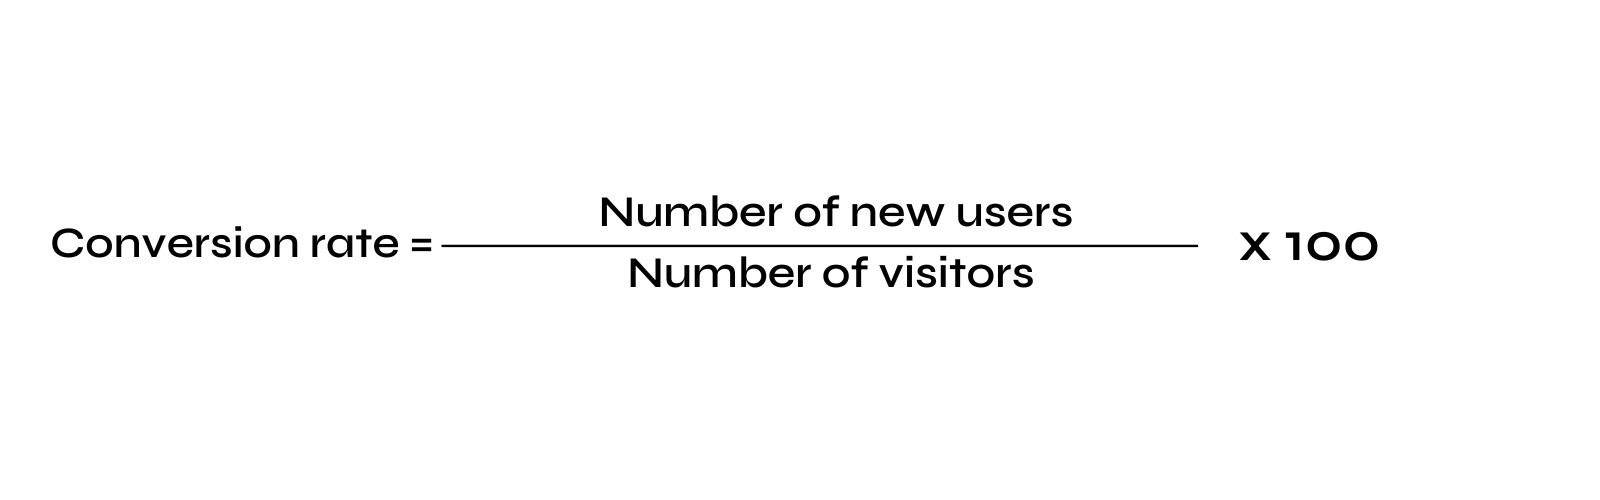
Example: Let's say you had 500 visitors to your community website last month, and 100 of them became users during that same period:
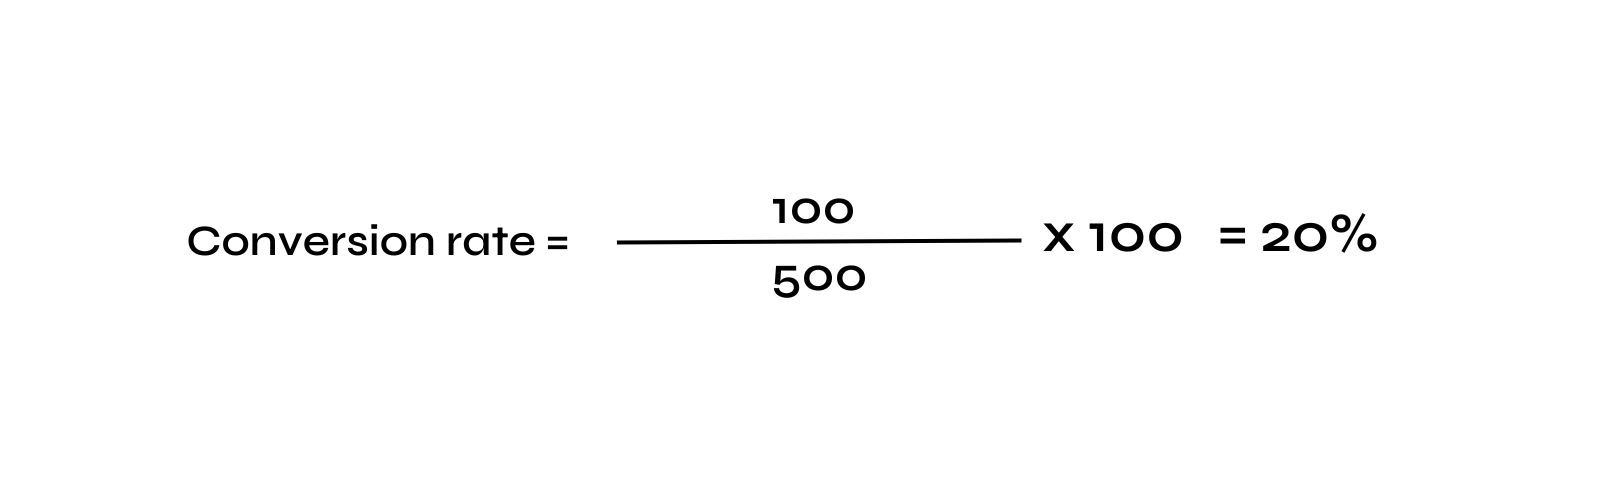
This means 20% of visitors to your community website became users.
Referral rate: Measures the percentage of new users who joined your community due to referrals from existing users. To calculate this rate, you can divide the number of new users who were referred by the total number of new users over a certain time.
Organic growth rate: This is the rate at which your community is growing without any marketing or outreach efforts. You can calculate this by subtracting the number of new users from the number of users who left your community over a certain time.
Active user growth rate: This is the rate at which your active user base is growing over time. You can calculate this by dividing the number of new active users by the total number of active users over a certain time.
PERCEPTION
It can provide insights into your community's feedback. This can help you identify areas that need improvement and refine your strategy to better meet the needs of your community.
We advise you to dive into:
User comments across social media
Don't underestimate the power of qualitative data! It can be really helpful in providing additional insights and context to your community-building efforts. For example, if your community members post on the platforms about how your project helped them solve a problem – save those comments! Use them to demonstrate success and value-added in a real way.
Direct Feedback/Tickets/Emails
Collect any direct feedback you receive and make your community feel valued. It's perfectly valid to have areas for improvement, so demonstrate that you're paying attention and recognizing your community as an important part of the project.
Now you know...
By measuring engagement, growth, and retention, you can gather valuable insights to help you build a thriving community. Best of luck!
Summary
Congratulations! You have completed Module 5 of the CM360 Course. Let's review the main learnings:
- This module explores the importance of data and analytics in community building.
- Starting with a clear goal is essential before diving into data analysis.
- Health checks help you assess the status of your community.
- Engagement, retention, growth, and perception are key metrics to measure.
- For engagement, consider both the quantity and quality of your community actions.
- Engagement rate, retention rate, and new user retention rate are some formulas you can use.
- To measure growth you can count the number of new users and calculate the conversion rate, organic growth rate, and active user growth rate.
- Perception analysis can tell you what community members are thinking and feeling about your community.
- User comments across social media and direct feedback are two ways to collect qualitative data.
So, do you want to keep learning? Look at the full course here and join the conversation on Discord to start building your network in the Web3 space today!